Please cite this article as: ZHENG W, XIN QJ, WANG XX, LI S, Wang X, NIE SP. Association between glycated hemoglobin and cognitive impairment in older adults with coronary heart disease: a multicenter prospective cohort Study. J Geriatr Cardiol 2025; 22(3): 381−388. DOI: 10.26599/1671-5411.2025.03.010.
Citation:
Please cite this article as: ZHENG W, XIN QJ, WANG XX, LI S, Wang X, NIE SP. Association between glycated hemoglobin and cognitive impairment in older adults with coronary heart disease: a multicenter prospective cohort Study. J Geriatr Cardiol 2025; 22(3): 381−388. DOI: 10.26599/1671-5411.2025.03.010.
Please cite this article as: ZHENG W, XIN QJ, WANG XX, LI S, Wang X, NIE SP. Association between glycated hemoglobin and cognitive impairment in older adults with coronary heart disease: a multicenter prospective cohort Study. J Geriatr Cardiol 2025; 22(3): 381−388. DOI: 10.26599/1671-5411.2025.03.010.
Citation:
Please cite this article as: ZHENG W, XIN QJ, WANG XX, LI S, Wang X, NIE SP. Association between glycated hemoglobin and cognitive impairment in older adults with coronary heart disease: a multicenter prospective cohort Study. J Geriatr Cardiol 2025; 22(3): 381−388. DOI: 10.26599/1671-5411.2025.03.010.
Center for Coronary Artery Disease, Division of Cardiology, Beijing Anzhen Hospital, Capital Medical University, Beijing, China
2.
Department of Geriatric Cardiology, National Clinical Research Center for Geriatric Diseases, Chinese PLA General Hospital, Beijing, China
Funds: The study has been funded by National Natural Science Foundation of China (grant numbers 82270258, 82100260), National Key Research & Development Program of China (grant number 2020YFC2004800).
The relationship between glycated hemoglobin (HbA1c) and cognitive impairment in older adults with coronary heart disease (CHD) remains unclear.
Methods
The present study used a prospective cohort study design and included 3244 participants aged ≥ 65 years in Beijing, China. The Mini-Mental State Examination (MMSE) and Montreal Cognitive Assessment (MoCA) were used to assess cognitive function. Serum HbA1c was detected at admission. All patients were divided into high HbA1c group (≥ 6.5mmol/L) and low HbA1c group (< 6.5mmol/L) based on their HbA1c levels. Logistic regression analyses were used to evaluate the association between HbA1c and cognitive impairment.
Results
In this study of 3244 participants, 1201 (37.0%) patients were in high HbA1c group and 2045 (63.0%) patients were in a state of cognitive impairment. Logistic regression analyses demonstrated that HbA1c was an independent risk factor for cognitive impairment regardless of whether the HbA1c was a continuous or categorical variable (OR = 1.27, 95% CI: 1.15–1.40, P < 0.001; OR = 1.79, 95% CI: 1.41–2.26, P ≤ 0.001, respectively). The restricted cubic spline curve exhibited that the relationship between the HbA1c and cognitive impairment was linear (p for non-linear = 0.323, P < 0.001).
Conclusion
Elevated levels of HbA1c were associated with an increased risk of cognitive impairment in older patients with CHD. These insights could be used to improve the accuracy and sensitivity of cognitive screening in these patient populations.
Global population aging is projected to increase the number of individuals over 60 years old from 760 million to 1.6 billion by 2050. This demographic transition is associated with an increased prevalence of chronic diseases, including coronary heart disease (CHD), stroke, diabetes, renal insufficiency, and dementia.[1] Dementia, specifically, is expected to pose a substantial health and socioeconomic burden, with projections estimating 150 million cases by 2050.[2]
An association between CHD onset and accelerated cognitive decline has been demonstrated in observational studies.[3] The risk of cognitive impairment in CHD patients increases with age. Glycosylated hemoglobin (HbA1c) is established as a critical marker for long-term glycemic control and an independent risk factor for various diseases. However, its role in cognitive impairment among elderly CHD patients remains to be elucidated.[4-7]
The association between elevated HbA1c levels and diminished cognitive function has been observed. However, the relationship between HbA1c and cognitive function in CHD patients, particularly in older individuals, remains understudied. Further investigation is necessary to elucidate the potential correlation between HbA1c and cognitive impairment in this specific population. Therefore, we analyzed data on frailty and comorbidity in elderly patients to explore the relationship between HbA1c level and cognitive function in elderly patients with CHD.
METHODS
Study Population
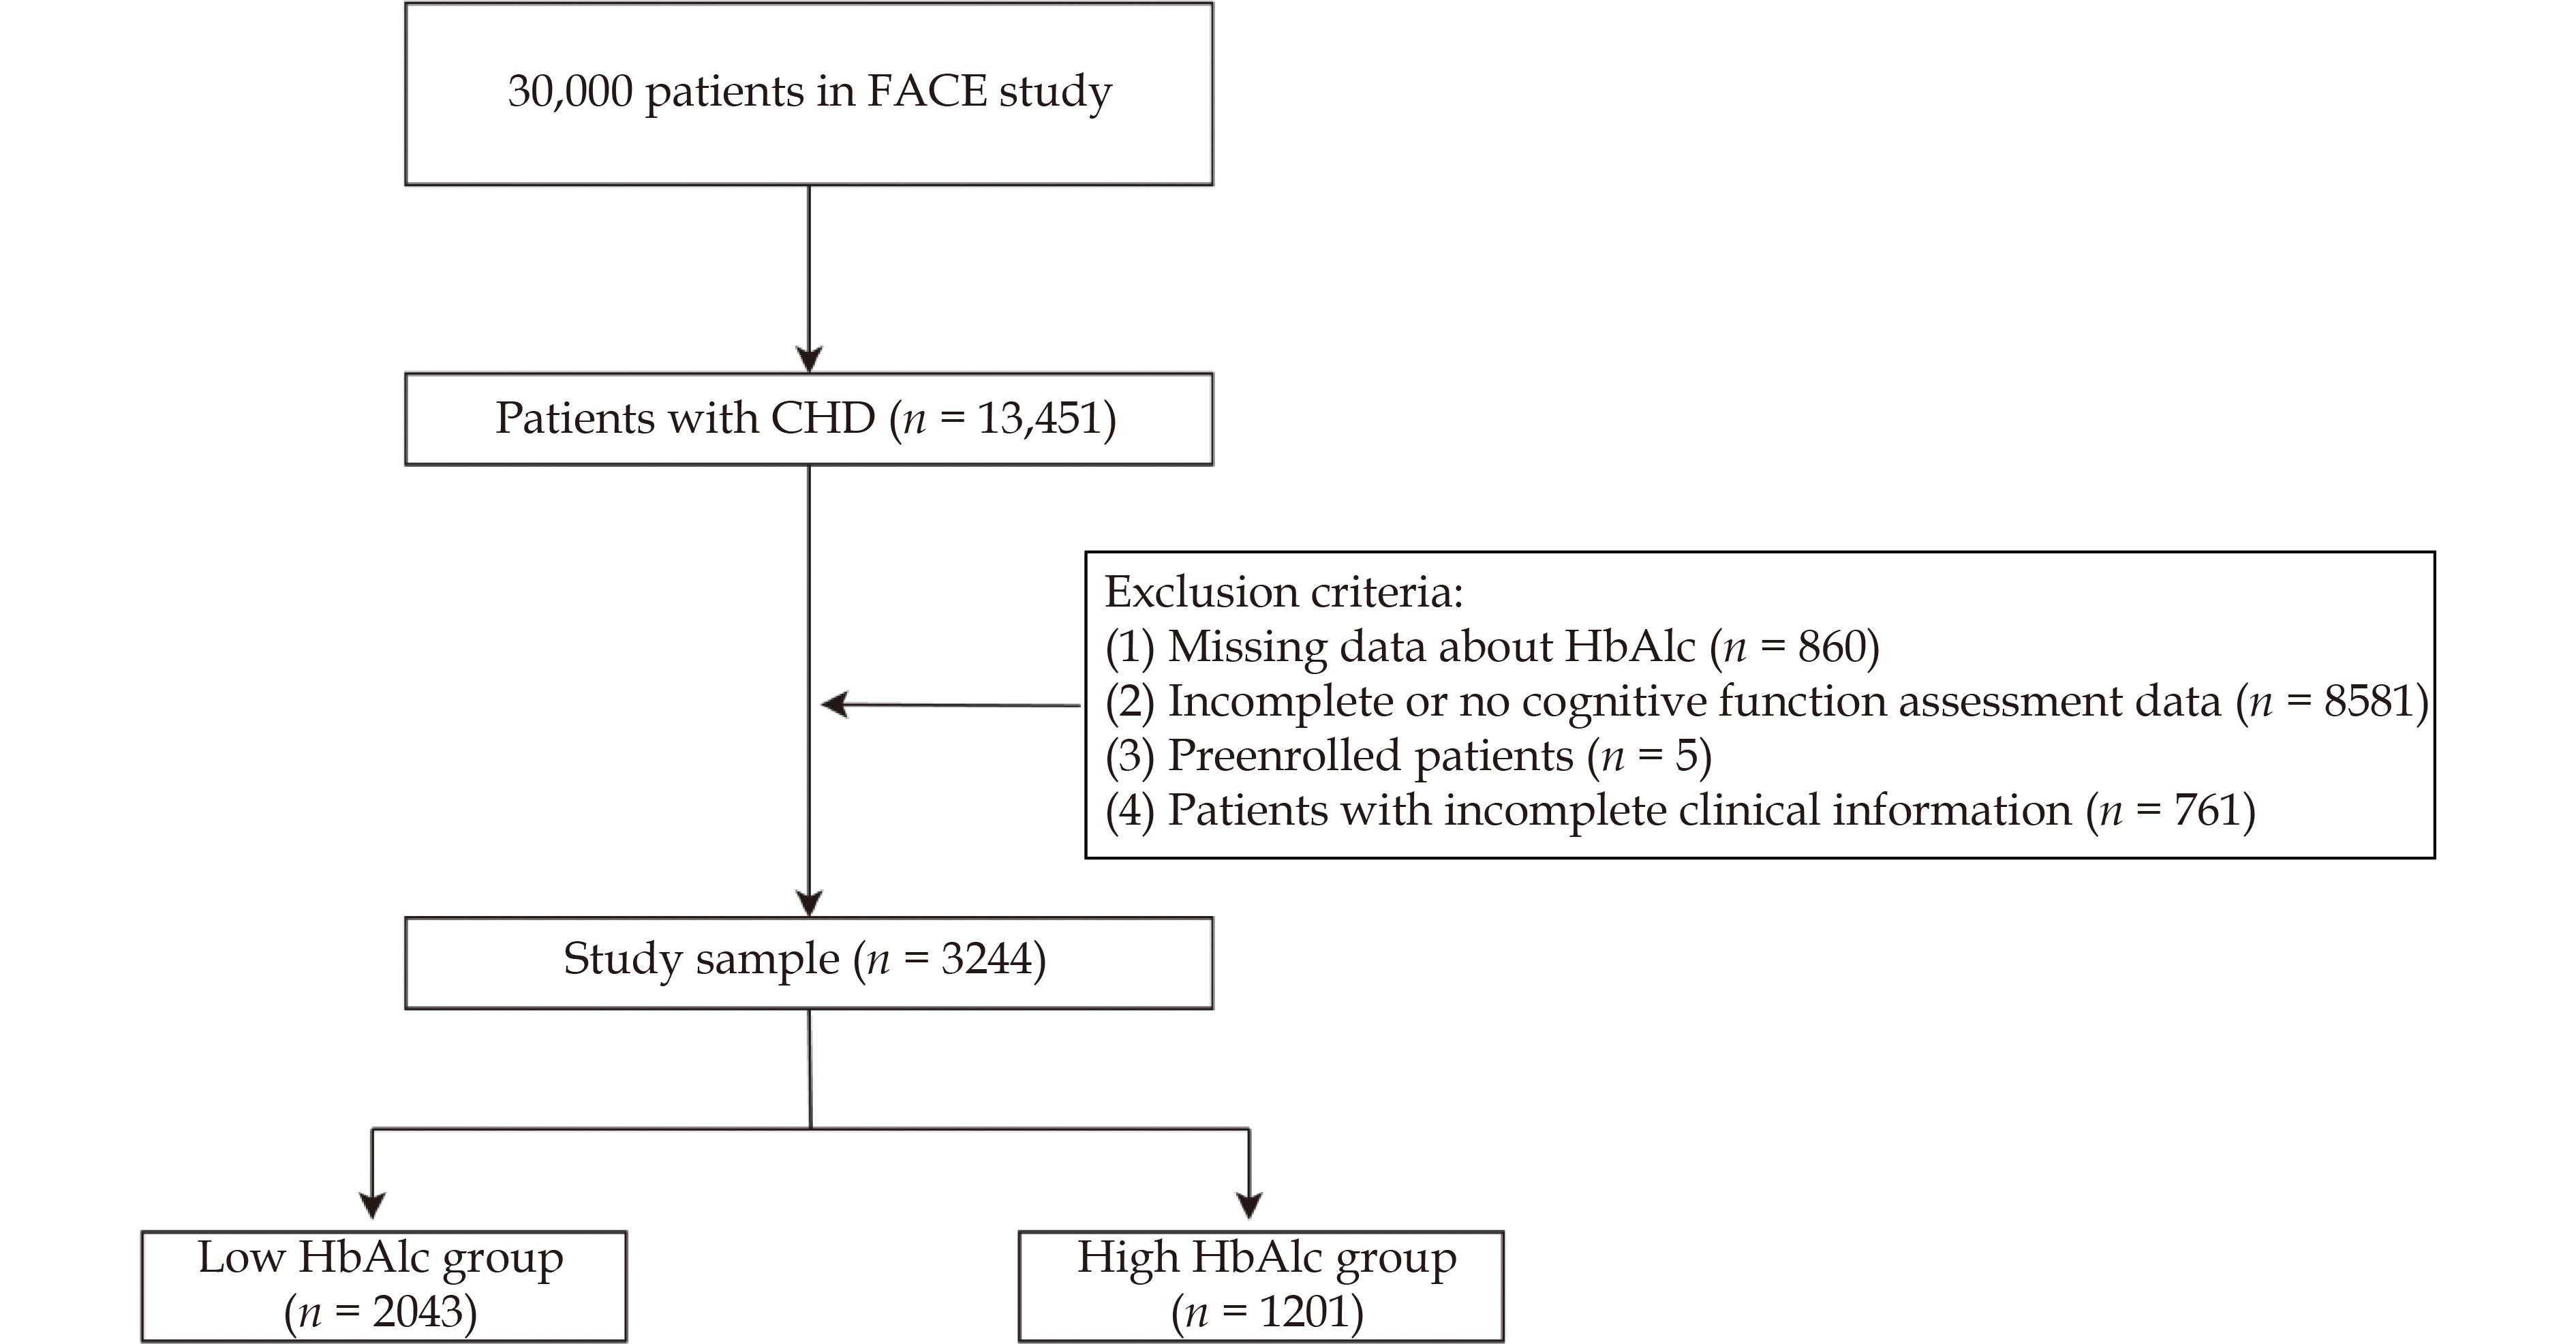
This sub-analysis utilized data from the Frailty And Comorbidity in Elderly patients (FACE) study (ChiCTR2200056070), a previously described multi-center prospective observational study.[8] The FACE study enrolled 30,000 patients aged ≥65 years with multimorbidity between June 2020 and July 2023. The current analysis focused on patients with a primary diagnosis of CHD (n = 13,451).
Patients were excluded based on the following criteria: absence of cognitive function screening (n = 8157), incomplete cognitive (n = 424) or clinical information (n = 761), pre-enrollment (n = 5), and missing HbA1c data (n = 860) (Fig.1). The final cohort comprised 3,244 patients, stratified into two groups based on HbA1c levels: high (≥ 6.5 mmol/L) and low (< 6.5 mmol/L).
Figure
1.
Study flowchart.
CHD: coronary heart disease; FACE: frailty and comorbidity in elderly patients.
The study protocol was approved by the Ethics Committee of Beijing Anzhen Hospital, Beijing, China (No. 2021156X) and conducted in accordance with the Declaration of Helsinki. Written informed consent was obtained from all participants.
Cognitive Function Measurement
Cognitive function was assessed using the Mini-Mental State Examination (MMSE) and the Montreal Cognitive Assessment (MoCA). The MMSE, a 30-point test, determines cognitive impairment based on the final score and educational level.[9] For patients who are illiterate, a score below 17 on the MMSE indicates cognitive impairment. For those with primary education, the diagnostic threshold is 20, and for those with junior high school education or higher, the threshold for determining cognitive impairment is 24 points. The MoCA, also scored out of 30 points, defines cognitive impairment as a score < 26.[10,11] Both MMSE and MoCA assessments were conducted by professionally trained independent physicians. Cognitive impairment was defined as a low score on either the MMSE or MoCA, while normal cognitive function required normal scores on both tests.
Statistical Analysis
Quantitative data were presented as mean ± SD or median (first and third quartiles) and analyzed using Student's t-test or Mann–Whitney U test. Qualitative data were expressed as percentages (%) and analyzed using χ2 test or Fisher's exact test. Univariate and multivariate logistic regression analyses were performed to investigate the independent association between HbA1c and cognitive impairment. Results were presented as odds ratios (OR) with 95% CI.
The multivariate analysis included variables showing significant differences in univariate analysis or clinical relevance: gender, age, BMI, education level (illiteracy, primary school, junior high school and above), current smoking status, current alcohol consumption, hypertension, hyperlipidemia, and history of stroke. HbA1c was treated as both a continuous and categorical variable in the logistic regression analysis. A restricted cubic spline (RCS) curve was constructed to illustrate the relationship between HbA1c and cognitive impairment. Subgroup analyses were conducted to assess consistency across subgroups.
Statistical analyses were performed using SPSS 27.0 (IBM Corporation, IL, USA) and R programming language 4.3.3 (Vienna, Austria). All P-values were two-tailed, with statistical significance defined as P < 0.05.
RESULTS
Patient Characteristics
The study population was stratified into two groups based on HbA1c levels: low (< 6.5%) and high (≥ 6.5%). Significant differences in demographic and clinical characteristics were observed between the groups. The high HbA1c group demonstrated a higher proportion of females (45.55% vs. 39.06%, P < 0.001) and a higher mean BMI. Regarding cardiovascular risk factors, the high HbA1c group exhibited elevated levels of white blood cell count, platelet counts, triglycerides, and fasting blood glucose (all P < 0.001). Conversely, the prevalence of dyslipidemia was lower in the high HbA1c group (55.95% vs. 61.28%, P = 0.003), accompanied by lower HDL cholesterol levels and estimated glomerular filtration rate (eGFR) (both P < 0.001). The high HbA1c group also presented higher prevalence of hypertension (72.77% vs. 69.02%, P = 0.024), prior stroke (10.07% vs. 7.88%, p = 0.032), and prior percutaneous coronary intervention (PCI) (28.56% vs 24.87%, P = 0.021) (Table 1).
Table
1.
Baseline clinical characteristics of study participants by HbA1c category.
Variables
Total population (n = 3244%)
Low HbA1c group (< 6.5 mmol/L) (n = 2043%)
High HbA1c group (≥ 6.5 mmol/L) (n = 1201%)
P-value
Demographics
Age, years
70.41 ± 4.37
70.39 ± 4.41
70.43 ± 4.31
0.791
Sex
< 0.001
Male
1899 (58.54%)
1245 (60.94%)
654 (54.45%)
Female
1345 (41.46%)
798 (39.06%)
547 (45.55%)
BMI, kg/m2
27.29 ± 4.92
27.00 ± 4.86
27.78 ± 4.98
<.001
Education status
0.107
Illiteracy
282 (8.89%)
176 (8.83%)
106 (9.01%)
Primary school
588 (18.54%)
348 (17.45%)
240 (20.39%)
Junior high school and above
2301 (72.56%)
1470 (73.72%)
831 (70.60%)
Medical histories
Hypertension
2284 (70.41%)
1410 (69.02%)
874 (72.77%)
0.024
T2DM
1296 (39.95%)
280 (13.71%)
1016 (84.60%)
< 0.001
dyslipidemia
1924 (59.31%)
1252 (61.28%)
672 (55.95%)
0.003
Prior MI
243 (7.49%)
146 (7.15%)
97 (8.08%)
0.331
Prior stroke
282 (8.69%)
161 (7.88%)
121 (10.07%)
0.032
Prior PCI
851 (26.23%)
508 (24.87%)
343 (28.56%)
0.021
Current smoking
807 (28.28%)
517 (28.93%)
290 (27.18%)
0.315
Current drinking
561 (19.70%)
364 (20.43%)
197 (18.50%)
0.211
Baseline laboratory test
WBC, x 109/L%)
6.38 ± 1.73
6.18 ± 1.66
6.70 ± 1.78
< 0.001
Hemoglobin, g/L
136.80 ± 15.73
137.39 ± 15.50
136.48 ± 15.84
0.110
PLT, x109/L
214.42 ± 59.89
211.49 ± 59.15
219.19 ± 60.81
0.001
Total cholesterol, mmol/L
4.11 ± 1.03
4.10 ± 1.00
4.12 ± 1.06
0.601
Triglyceride, mmol/L
1.62 ± 0.97
1.52 ± 0.84
1.77 ± 1.14
< 0.001
HDL-C, mmol/L
1.14 ± 0.28
1.17 ± 0.29
1.09 ± 0.25
< 0.001
LDL-C, mmol/L
2.20 ± 0.82
2.20 ± 0.81
2.20 ± 0.84
0.961
Hs-CRP, mg/L
2.09 ± 2.85
2.04 ± 2.90
2.19 ± 2.75
0.191
eGFR, mL/min per 1.73 m2
80.02 ± 15.07
81.03 ± 13.96
78.32 ± 16.66
< 0.001
FBG, mmol/L
7.48 ± 3.27
6.25 ± 1.80
9.57 ± 4.06
< 0.001
HbA1c
6.50% ± 1.18%
5.80% ± 0.34%
7.69 ± 1.15
< 0.001
Data are presented as mean ± SD, median (first quartile to third quartile), or n (%). BMI: body mass index; eGFR: estimated Glomerular filtration rate; FBG: fasting blood sugar; HbA1c: glycated hemoglobin; Hs-CRP: high sensitivity C-reactive protein; HDL-C: high-density lipoprotein cholesterol; LDL-C: low-density lipoprotein cholesterol; PCI: percutaneous coronary intervention; PLT: platelet; T2DM: type 2 diabetes; WBC: white blood cell.
Cognitive function assessment was conducted using the MMSE and the MoCA scales. The high HbA1c group demonstrated significantly lower performance in MMSE domains of orientation (P = 0.023), concentration/calculation (P = 0.016), and language (P < 0.001). Similarly, MoCA results revealed significantly poorer performance in the high HbA1c group for visuospatial (P < 0.001), attention (P = 0.006), language (P < 0.001), and orientation (P = 0.032) subdomains. A trend towards lower performance in memory and abstraction domains was observed in the high HbA1c group, although not statistically significant (P = 0.064) (Table 2).
Table
2.
Cognitive assessment results of study participants by HbA1c category.
Variables
Total population (n = 3244)
Low HbA1c group (< 6.5 mmol/L) (n = 2043)
High HbA1c group (≥ 6.5 mmol/L) (n = 1201)
P-value
MMSE Scale
MMSE Total score
27.53 ± 2.90
27.65 ± 2.81
27.33 ± 3.05
0.002
Orientation
9.70 ± 0.87
9.73 ± 0.83
9.65 ± 0.94
0.023
Memory
2.94 ± 0.30
2.94 ± 0.29
2.94 ± 0.31
0.789
Concentration And Calculation
4.14 ± 1.38
4.18 ± 1.34
4.06 ± 1.44
0.016
Recall
2.28 ± 0.88
2.30 ± 0.87
2.25 ± 0.89
0.205
Language
8.47 ± 0.87
8.78 ± 0.52
8.29 ± 0.97
< 0.001
MoCA Scale
MoCA Total score
22.85 ± 4.19
23.08 ± 4.13
22.45 ± 4.27
< 0.001
Visuospatial
3.31 ± 1.32
3.39 ± 1.31
3.19 ± 1.33
< 0.001
Naming
2.84 ± 0.49
2.84 ± 0.48
2.83 ± 0.51
0.716
Memory
2.23 ± 1.44
2.27 ± 1.45
2.17 ± 1.43
0.064
Attention
5.47 ± 1.01
5.51 ± 0.97
5.40 ± 1.06
0.006
Language
2.07 ± 0.78
2.11 ± 0.78
2.00 ± 0.78
< 0.001
Abstraction
1.15 ± 0.80
1.17 ± 0.80
1.11 ± 0.80
0.064
Delay Call
2.23 ± 1.43
2.26 ± 1.44
2.16 ± 1.41
0.060
Orientation
5.79 ± 0.67
5.81 ± 0.64
5.75 ± 0.71
0.032
SAS Scale
38.03 ± 9.14
37.95 ± 8.98
38.19 ± 9.42
0.470
ADL Scale
14.50 ± 2.21
14.42 ± 1.98
14.62 ± 2.55
0.021
SDS Scale
35.85 ± 7.66
35.72 ± 7.51
36.06 ± 7.91
0.234
Data are presented as mean ± SD. ADL: Activities of daily living; MMSE: Mini-mental state examination; MoCA: montreal cognitive assessment; SAS: self-rating anxiety scale; SDS: self-rating depression scale.
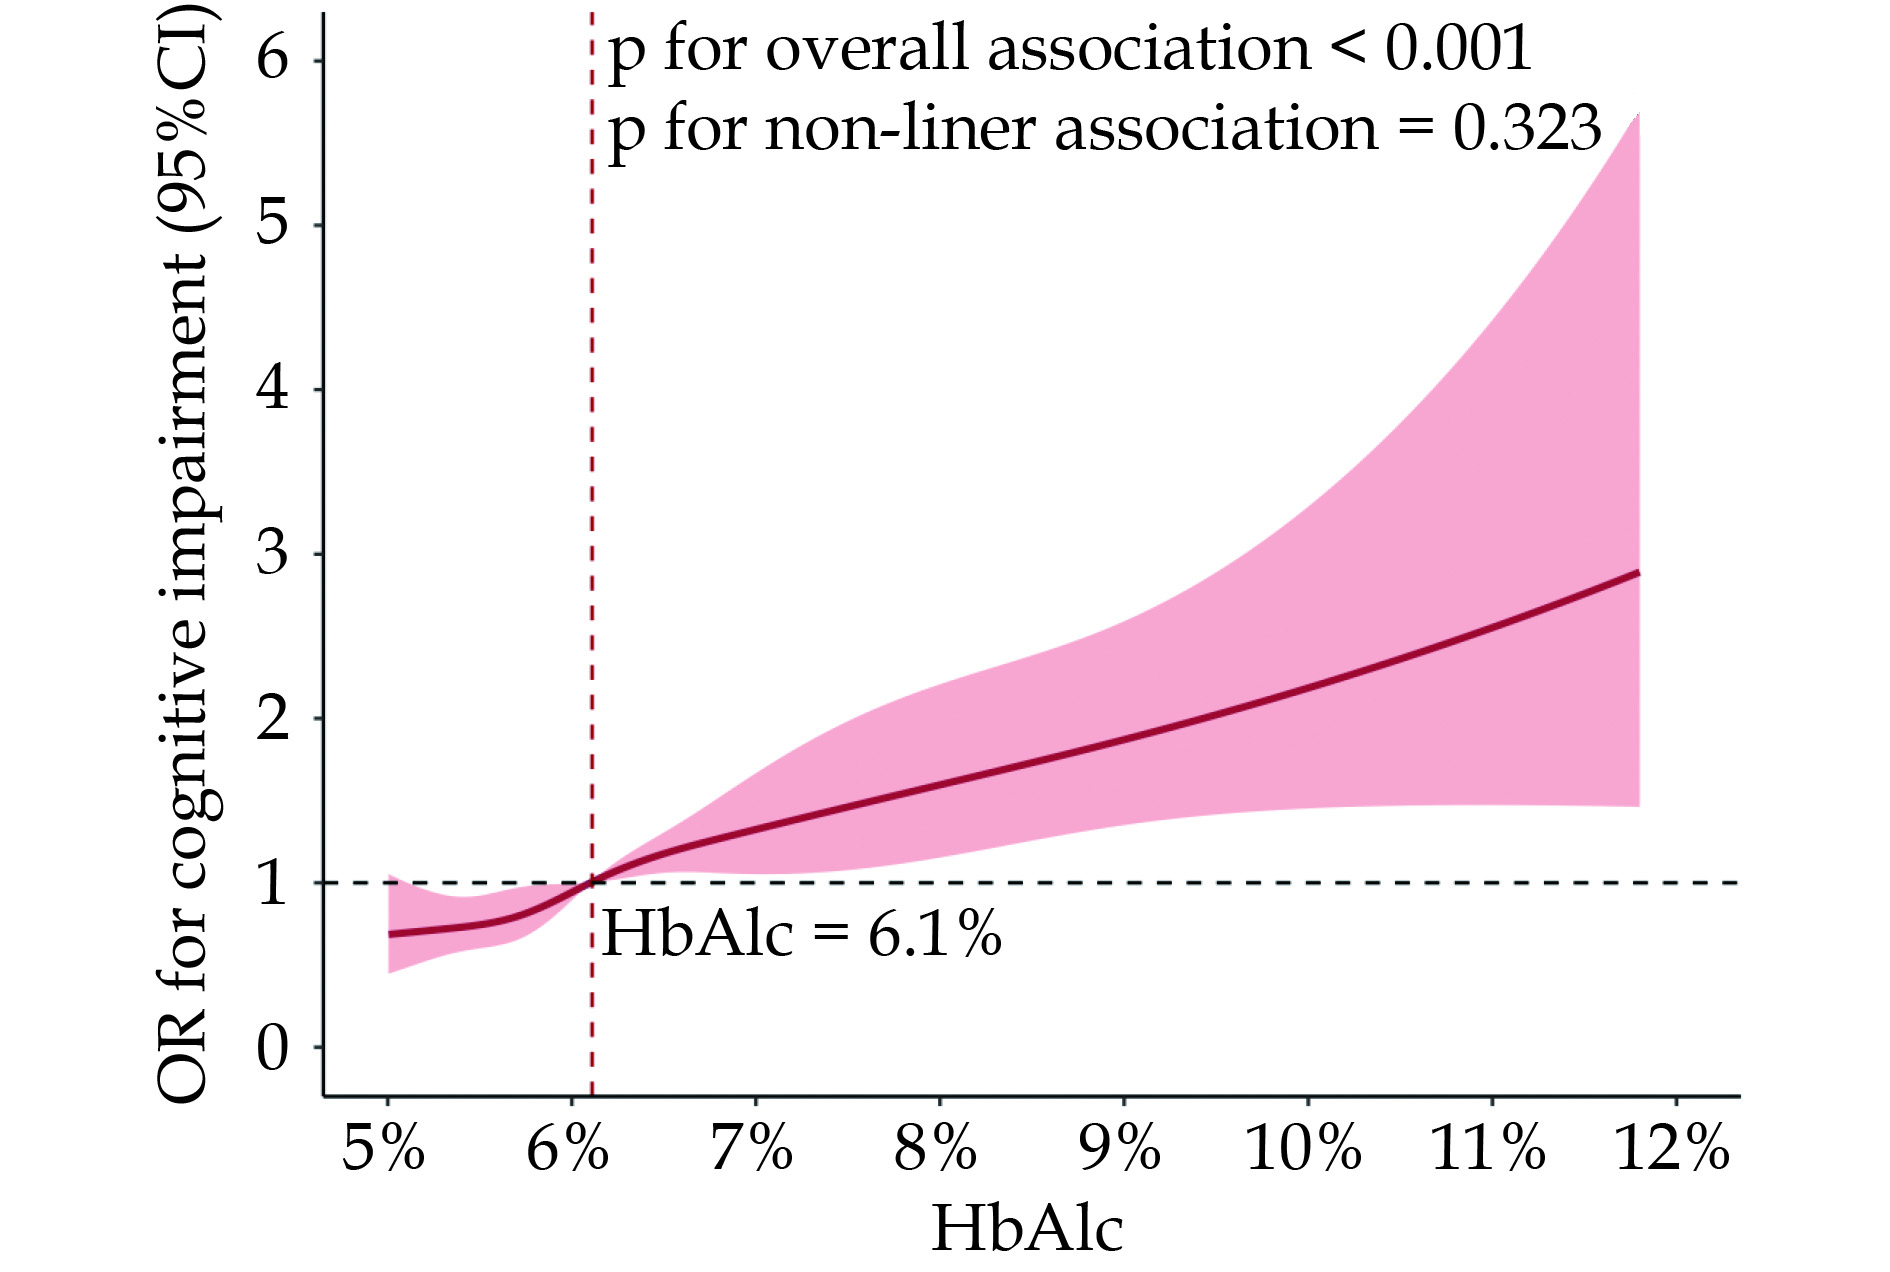
Logistic regression analysis was conducted to identify risk factors associated with cognitive impairment in elderly CHD patients. After adjustment for potential confounders, high HbA1c levels (≥ 6.5%) were identified as an independent risk factor (OR = 1.79, 95% CI: 1.41−2.26; P < 0.001) (Table 3). A restricted cubic spline (RCS) plot demonstrated a significant overall association (P < 0.001) between increasing HbA1c levels and cognitive impairment odds (Figure 2). The risk of cognitive impairment increased steadily with rising HbA1c levels, even within the normal range (6.1%−6.5%). A more rapid increase in risk was observed when HbA1c levels exceeded 6.5%, corroborating the logistic regression results. Additional significant risk factors included older age (OR = 1.02 per year, P = 0.011) and history of stroke (OR = 1.35, P = 0.051). Higher education level, particularly junior high school and above, was identified as a protective factor against cognitive impairment (OR = 0.23, 95% CI: 0.15−0.33, P < 0.001) compared to illiteracy.
Table
3.
Logistic regression analyses of risk factors associated with cognitive impairment in elderly CHD patients.
Variables
OR (95%CI)
P
Age
1.02 (1.01−1.04)
0.011
BMI
1.00 (0.98−1.02)
0.800
HbA1c ≥ 6.5%
1.79 (1.41−2.26)
<.001
Female
1.20 (0.98−1.47)
0.085
Education
Primary school*
0.67 (0.43−1.02)
0.062
Junior high school and above*
0.23 (0.15−0.33)
<.001
Smoking
1.13 (0.88−1.44)
0.335
Drinking
0.87 (0.67−1.13)
0.285
Prior stroke
1.35 (1.00−1.82)
0.051
Prior revascularization
1.12 (0.93−1.34)
0.250
Hypertension
0.91 (0.76−1.09)
0.312
Hyperlipidemia
0.87 (0.74−1.03)
0.099
*Illiteracy as ref. BMI: body mass index; HbA1c: Glycated hemoglobin.
Figure
2.
RCS curve for the association of HbA1c levels with odd ratio of cognitive impairment in elderly patients with CHD.
The red line represents the odds ratio (OR), and the shaded area represents the 95% CI. The RCS analysis was performed by using adjusted logistic model (adjusted for sex, age, BMI, education, current smoking, current drinking, prior stroke, hypertension, hyperlipidemia). The OR was examined by per 1-unit increase of HbA1c. CHD: coronary heart disease; RCS: restricted cubic splines.
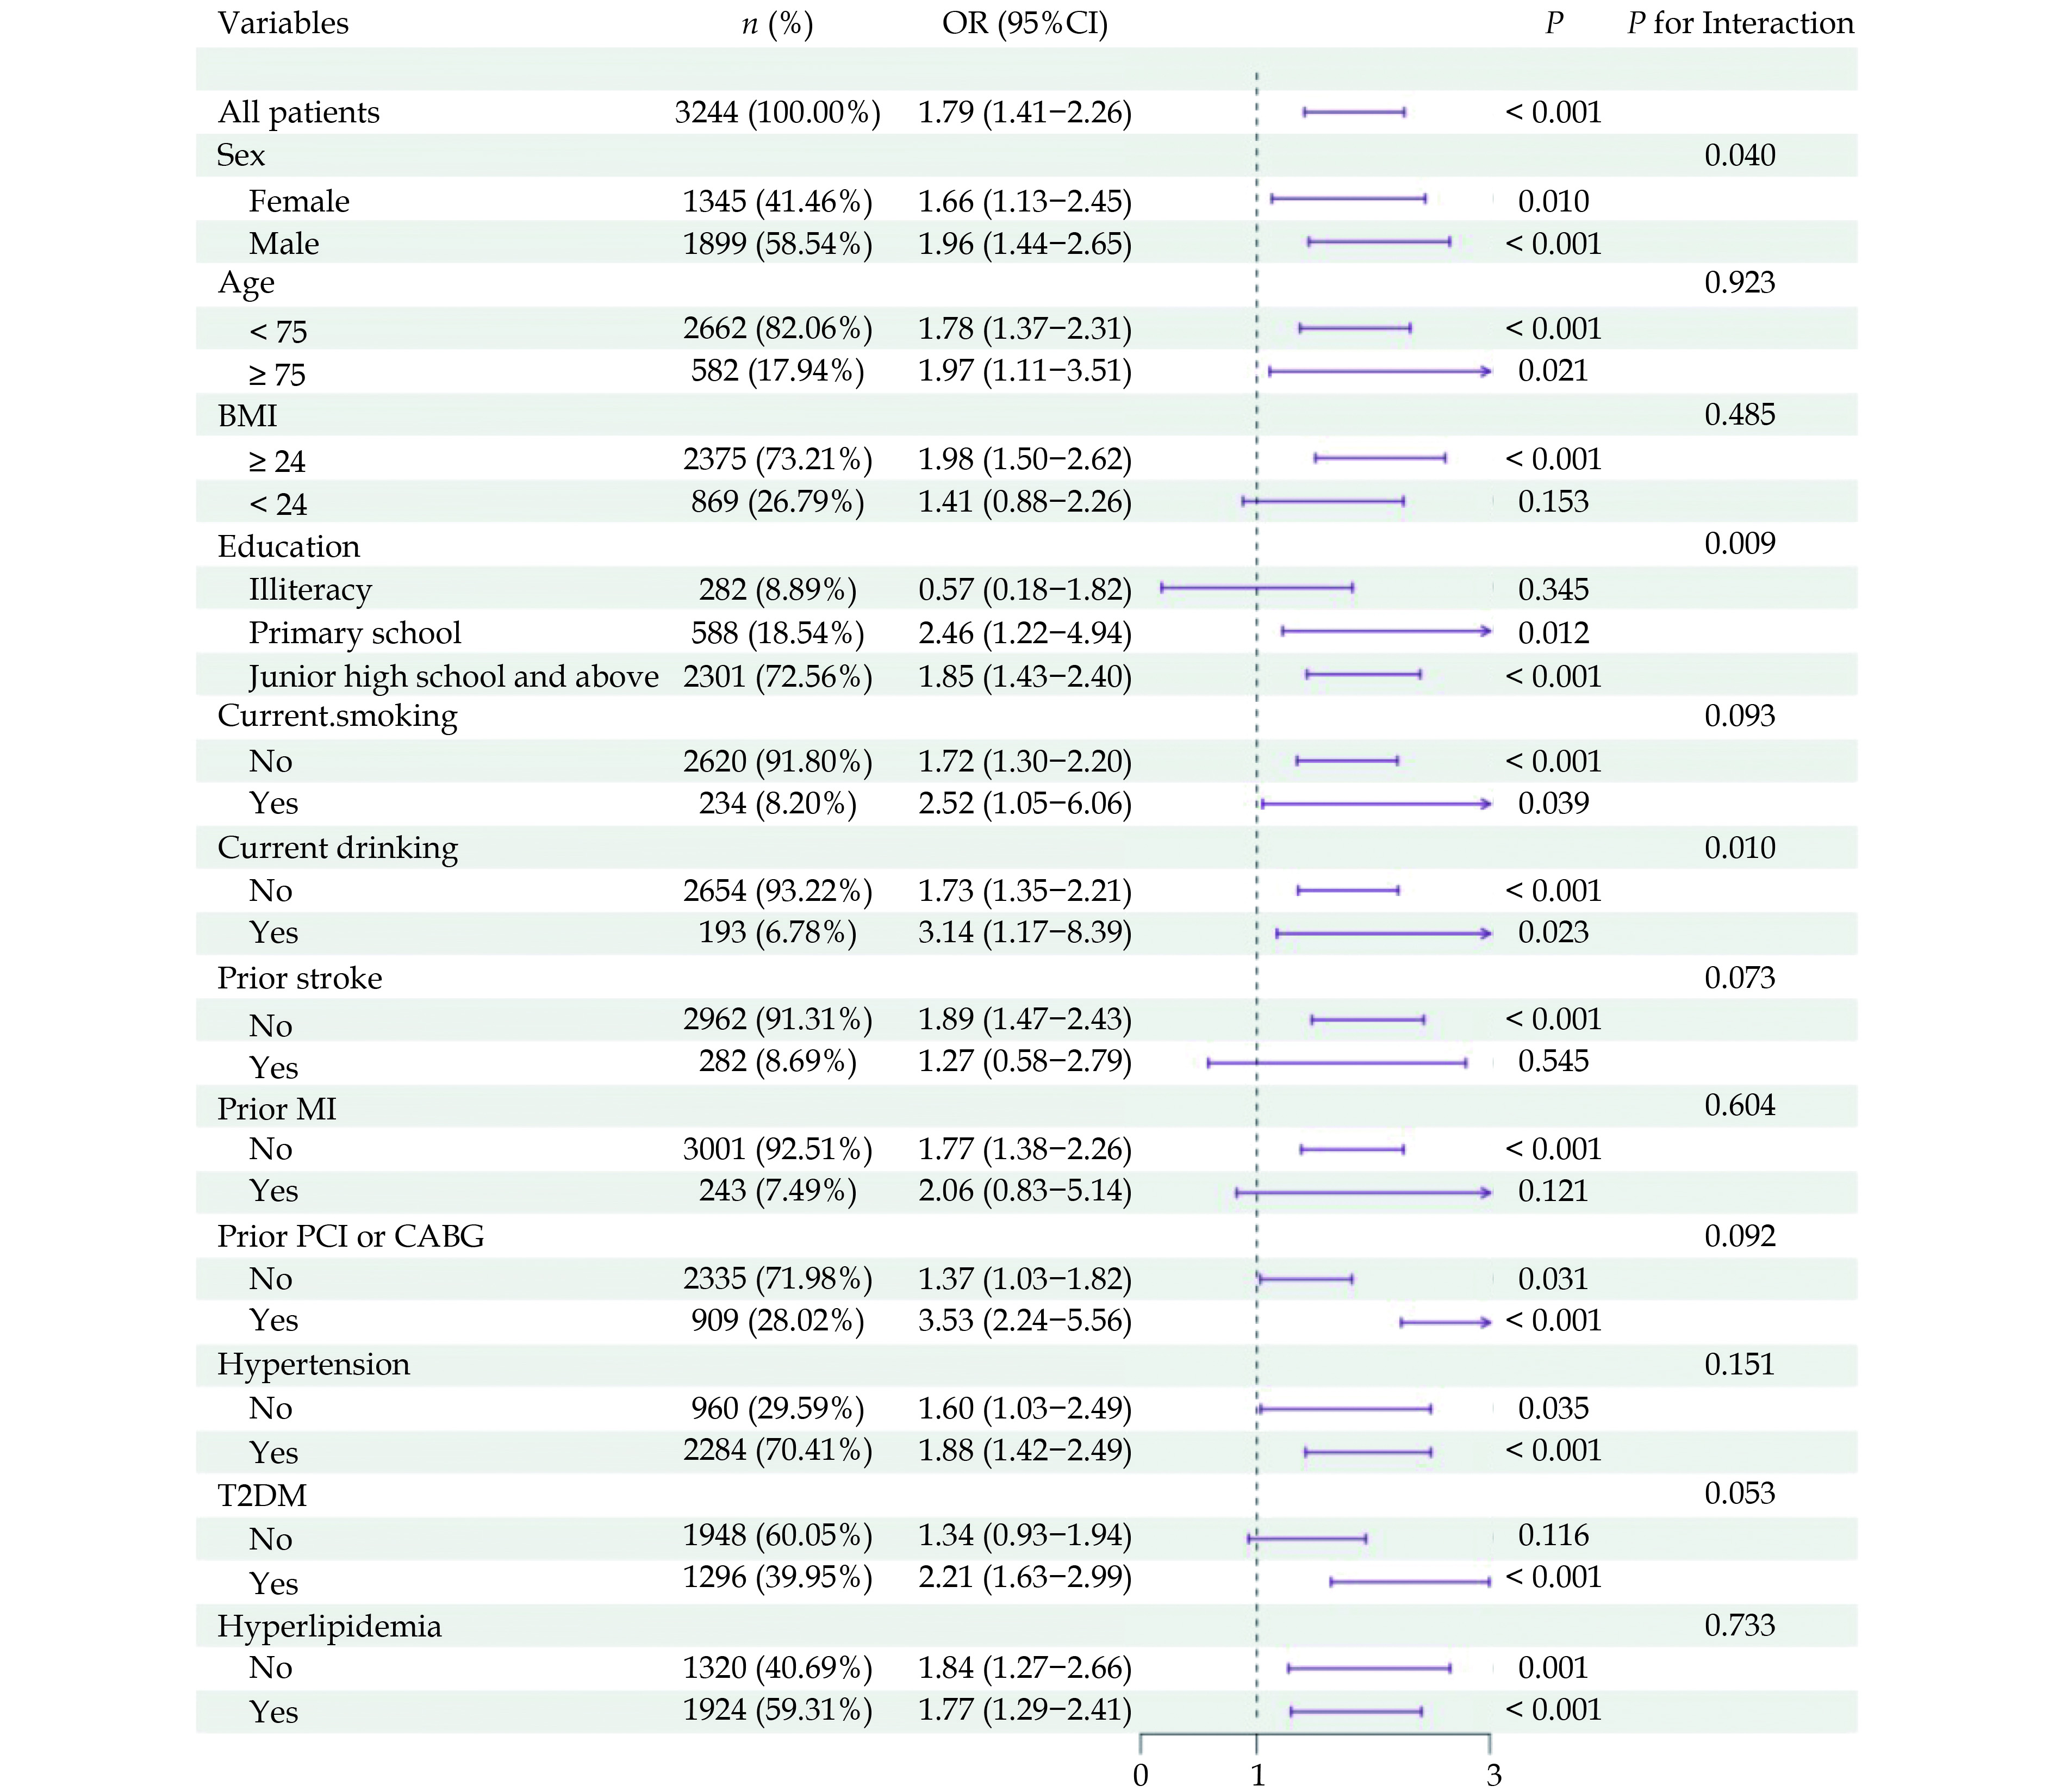
Subgroup analyses were performed to investigate potential effect modifiers in the association between HbA1c levels and cognitive impairment risk (Figure 3). In patients aged ≥75 years, high HbA1c was associated with a twofold increased risk of cognitive impairment (OR = 1.97, 95% CI: 1.11−3.48, P = 0.02). The association was more pronounced in males (OR = 2.04, 95% CI: 1.51−2.75, P < 0.001) compared to females (OR = 1.68, 95% CI: 1.14−2.45, P = 0.008). Comorbidities significantly modified the effect of high HbA1c on cognitive impairment risk. Patients with both high HbA1c and type 2 diabetes exhibited a substantially higher risk (OR = 2.27, 95% CI: 1.68−3.07, P < 0.001) compared to non-diabetic patients, suggesting a potential synergistic effect. The association was notably stronger in patients with a history of PCI or CABG (OR = 3.60, 95% CI: 2.29−5.67, P < 0.001). Higher BMI and education status were also found to potentiate the negative cognitive effects of high HbA1c.
Figure
3.
Subgroup analysis of the association between high HbA1c (≥ 6.5%) and risk of cognitive impairment.
The dotted line in the middle represents an OR value of 1. Subgroup analyses were performed by using an adjusted logistic regression model (adjusted for sex, age, BMI, education, current smoking, current drinking, prior stroke, hypertension, and hyperlipidemia). No in Education stands for illiteracy and Yes for primary education and above. CABG: coronary artery bypass graft; PCI: percutaneous coronary intervention; T2DM: type 2 diabetes.
In this study of 3,244 elderly patients with CHD, elevated HbA1c levels (≥6.5%) were independently associated with impaired cognitive function and increased likelihood of cognitive impairment. These findings corroborate the growing evidence linking poor glycemic control to cognitive decline in elderly individuals with cardiovascular comorbidities.
The high prevalence of cognitive impairment (66%) observed in this cohort significantly exceeds the 21% rate reported in community-dwelling older adults[12], underscoring the substantial cognitive burden in elderly CHD patients. Our findings are consistent with previous evidence linking CHD to accelerated cognitive decline and dementia risk. A meta-analysis by Wolters et al.[13] found a 26% higher risk of dementia in CHD patients compared with CHD-free individuals. In addition, longitudinal studies have also reported greater cognitive decline and incident dementia in individuals with a history of CHD[14]. A study by Deckers et al.[15] followed 3,229 participants for 12 years and found that CHD was associated with a 45% increased risk of dementia. Similarly, a population-based cohort study by Sundboll et al.[16] in 314,911 CHD patients demonstrated a 35% higher risk of all-cause dementia compared with the general population. Those results underscore the need for routine cognitive screening and management in this high-risk population.
High HbA1c was identified as an independent risk factor for cognitive impairment in elderly CHD patients, with a 1.79-fold increased odds after adjusting for potential confounders. The risk of cognitive impairment increased steadily with rising HbA1c levels, even within the normal range (6.1%−6.5%), suggesting the importance of optimal glycemic control for cognitive preservation. A threshold effect was observed when HbA1c exceeded 6.5%. However, conflicting data exist regarding the relationship between HbA1c and cognition, possibly due to differences in study populations, HbA1c cutoffs, and cognitive assessments[17-19].
Subgroup analyses revealed a particularly pronounced association between high HbA1c and cognitive impairment in specific high-risk groups, including older age (≥75 years), male sex, and presence of comorbid diabetes or hypertension. These findings suggest a potential synergistic effect of multiple cardiometabolic risk factors on brain health[20].
The pathophysiological mechanisms underlying the association between hyperglycemia, CHD, and cognitive dysfunction are multifaceted[21]. Chronic hyperglycemia induces oxidative stress and promotes the formation of advanced glycation end products (AGEs), which may compromise blood-brain barrier integrity and facilitate amyloid-beta accumulation[21]. Concomitantly, CHD can impair cerebral perfusion, potentially exacerbating neurodegenerative processes[22]. These processes, along with neuroinflammation and microvascular damage, contribute to cognitive decline[23,24].
This study’s strengths include its large sample size, comprehensive cognitive assessments, and detailed clinical characterization of participants. Limitations include potential residual confounding, selection bias, and limited regional representativeness due to recruitment from tertiary hospitals in two Chinese provinces.
Conclusion
This study demonstrates that high HbA1c is independently associated with worse cognitive performance and greater odds of cognitive impairment in elderly patients with CHD. Our findings underscore the importance of incorporating cognitive assessment and glycemic monitoring in the management of older adults with cardiovascular disease. Early identification of at-risk individuals and timely interventions targeting glycemic control and vascular health may be critical for preventing cognitive decline in this vulnerable population. Future longitudinal studies are warranted to elucidate the long-term cognitive trajectories and to develop targeted preventive strategies tailored to elderly CHD patients with suboptimal glycemic control.
DISCLOSURE
Acknowledgments
We would like to express our sincere gratitude to all the FACE study researchers.
Availability of data and materials
The datasets used and/or analyzed during the current study are available from the corresponding author upon reasonable request.
Financial/Nonfinancial Disclosures
None
Author contributions
Zheng W, Qing JX: Conceptualization, Writing - Original Draft, Data Curation, Formal analysis, Data Curation; Wang X: Writing - Original Draft, Methodology; Wang XN: Software; Li S, Nie SP: Supervision, Funding acquisition.
Ballesteros S, Kraft E, Santana S, Tziraki C. Maintaining older brain functionality: A targeted review. Neurosci Biobehav Rev 2015; 55: 453−477. doi: 10.1016/j.neubiorev.2015.06.008
[2]
Jia L, Du Y, Chu L, et al. Prevalence, risk factors, and management of dementia and mild cognitive impairment in adults aged 60 years or older in China: a cross-sectional study. Lancet Public Health 2020; 5: e661−e671. doi: 10.1016/S2468-2667(20)30185-7
[3]
Xie W, Zheng F, Yan L, et al. Cognitive Decline Before and After Incident Coronary Events. J Am Coll Cardiol 2019; 73: 3041−3050. doi: 10.1016/j.jacc.2019.04.019
[4]
Hermanides RS, Kennedy MW, Kedhi E, et al. Impact of elevated HbA1c on long-term mortality in patients presenting with acute myocardial infarction in daily clinical practice: insights from a 'real world' prospective registry of the Zwolle Myocardial Infarction Study Group. Eur Heart J Acute Cardiovasc Care 2020; 9: 616−625. doi: 10.1177/2048872619849921
[5]
Nomani AZ, Nabi S, Ahmed S, et al. High HbA1c is associated with higher risk of ischaemic stroke in Pakistani population without diabetes. Stroke Vasc Neurol 2016; 1: 133−139. doi: 10.1136/svn-2016-000018
[6]
Jiao X, Zhang Q, Peng P, et al. HbA1c is a predictive factor of severe coronary stenosis and major adverse cardiovascular events in patients with both type 2 diabetes and coronary heart disease. Diabetol Metab Syndr 2023; 15: 50. doi: 10.1186/s13098-023-01015-y
[7]
Huang X, Qin C, Guo X, et al. Association of hemoglobin A1c with the incidence of hypertension: A large prospective study. Front Endocrinol (Lausanne) 2022; 13: 1098012. doi: 10.3389/fendo.2022.1098012
[8]
Zheng W, Huang X, Suo M, et al. Protocol for the FACE study: frailty and comorbidity in elderly patients-a multicenter, Chinese observational cohort study. J Geriatr Cardiol 2023; 20: 83−90. doi: 10.26599/1671-5411.2023.01.009
[9]
Arevalo-Rodriguez I, Smailagic N, Roqué-Figuls M, et al. Mini-Mental State Examination (MMSE) for the early detection of dementia in people with mild cognitive impairment (MCI). Cochrane Database Syst Rev 2021; 7: CD010783. doi: 10.1002/14651858.CD010783.pub3
[10]
Nasreddine ZS, Phillips NA, Bédirian V, et al. The Montreal Cognitive Assessment, MoCA: a brief screening tool for mild cognitive impairment. J Am Geriatr Soc 2005; 53: 695−699. doi: 10.1111/j.1532-5415.2005.53221.x
[11]
Winblad B, Palmer K, Kivipelto M, et al. Mild cognitive impairment-beyond controversies, towards a consensus: report of the International Working Group on Mild Cognitive Impairment. J Intern Med 2004; 256: 240−246. doi: 10.1111/j.1365-2796.2004.01380.x
[12]
Jia L, Quan M, Fu Y, et al. Dementia in China: epidemiology, clinical management, and research advances. Lancet Neurol 2020; 19: 81−92. doi: 10.1016/S1474-4422(19)30290-X
[13]
Wolters FJ, Segufa RA, Darweesh SKL, et al. Coronary heart disease, heart failure, and the risk of dementia: A systematic review and meta-analysis. Alzheimers Dement 2018; 14: 1493−1504. doi: 10.1016/j.jalz.2018.01.007
[14]
Deckers K, Schievink SHJ, Rodriquez MMF, et al. Coronary heart disease and risk for cognitive impairment or dementia: Systematic review and meta-analysis. PLoS One 2017; 12: e0184244. doi: 10.1371/journal.pone.0184244
[15]
Deckers K, Barbera M, Köhler S, et al. Long-term dementia risk prediction by the LIBRA score: A 30-year follow-up of the CAIDE study. Int J Geriatr Psychiatry 2020; 35: 195−203. doi: 10.1002/gps.5235
[16]
Sundbøll J, Horváth-Puhó E, Adelborg K, et al. Higher Risk of Vascular Dementia in Myocardial Infarction Survivors. Circulation 2018; 137: 567−577. doi: 10.1161/CIRCULATIONAHA.117.029127
[17]
Zheng F, Yan L, Yang Z, et al. HbA(1c), diabetes and cognitive decline: the English Longitudinal Study of Ageing. Diabetologia 2018; 61: 839−848. doi: 10.1007/s00125-017-4541-7
[18]
Marden JR, Mayeda ER, Tchetgen Tchetgen EJ, et al. High Hemoglobin A1c and Diabetes Predict Memory Decline in the Health and Retirement Study. Alzheimer Dis Assoc Disord 2017; 31: 48−54. doi: 10.1097/WAD.0000000000000182
[19]
Rawlings AM, Sharrett AR, Mosley TH, et al. Glucose Peaks and the Risk of Dementia and 20-Year Cognitive Decline. Diabetes Care 2017; 40: 879−886. doi: 10.2337/dc16-2203
[20]
Saedi E, Gheini MR, Faiz F, et al. Diabetes mellitus and cognitive impairments. World J Diabetes 2016; 7: 412−422. doi: 10.4239/wjd.v7.i17.412
[21]
Biessels GJ, Strachan MW, Visseren FL, et al. Dementia and cognitive decline in type 2 diabetes and prediabetic stages: towards targeted interventions. Lancet Diabetes Endocrinol 2014; 2: 246−255. doi: 10.1016/S2213-8587(13)70088-3
[22]
Gayda M, Gremeaux V, Bherer L, et al. Cognitive function in patients with stable coronary heart disease: Related cerebrovascular and cardiovascular responses. PLoS One 2017; 12: e0183791. doi: 10.1371/journal.pone.0183791
[23]
Xue M, Xu W, Ou YN, et al. Diabetes mellitus and risks of cognitive impairment and dementia: A systematic review and meta-analysis of 144 prospective studies. Ageing Res Rev 2019; 55: 100944. doi: 10.1016/j.arr.2019.100944
[24]
Biessels GJ, Despa F. Cognitive decline and dementia in diabetes mellitus: mechanisms and clinical implications. Nat Rev Endocrinol 2018; 14: 591−604. doi: 10.1038/s41574-018-0048-7
Table
1.
Baseline clinical characteristics of study participants by HbA1c category.
Variables
Total population (n = 3244%)
Low HbA1c group (< 6.5 mmol/L) (n = 2043%)
High HbA1c group (≥ 6.5 mmol/L) (n = 1201%)
P-value
Demographics
Age, years
70.41 ± 4.37
70.39 ± 4.41
70.43 ± 4.31
0.791
Sex
< 0.001
Male
1899 (58.54%)
1245 (60.94%)
654 (54.45%)
Female
1345 (41.46%)
798 (39.06%)
547 (45.55%)
BMI, kg/m2
27.29 ± 4.92
27.00 ± 4.86
27.78 ± 4.98
<.001
Education status
0.107
Illiteracy
282 (8.89%)
176 (8.83%)
106 (9.01%)
Primary school
588 (18.54%)
348 (17.45%)
240 (20.39%)
Junior high school and above
2301 (72.56%)
1470 (73.72%)
831 (70.60%)
Medical histories
Hypertension
2284 (70.41%)
1410 (69.02%)
874 (72.77%)
0.024
T2DM
1296 (39.95%)
280 (13.71%)
1016 (84.60%)
< 0.001
dyslipidemia
1924 (59.31%)
1252 (61.28%)
672 (55.95%)
0.003
Prior MI
243 (7.49%)
146 (7.15%)
97 (8.08%)
0.331
Prior stroke
282 (8.69%)
161 (7.88%)
121 (10.07%)
0.032
Prior PCI
851 (26.23%)
508 (24.87%)
343 (28.56%)
0.021
Current smoking
807 (28.28%)
517 (28.93%)
290 (27.18%)
0.315
Current drinking
561 (19.70%)
364 (20.43%)
197 (18.50%)
0.211
Baseline laboratory test
WBC, x 109/L%)
6.38 ± 1.73
6.18 ± 1.66
6.70 ± 1.78
< 0.001
Hemoglobin, g/L
136.80 ± 15.73
137.39 ± 15.50
136.48 ± 15.84
0.110
PLT, x109/L
214.42 ± 59.89
211.49 ± 59.15
219.19 ± 60.81
0.001
Total cholesterol, mmol/L
4.11 ± 1.03
4.10 ± 1.00
4.12 ± 1.06
0.601
Triglyceride, mmol/L
1.62 ± 0.97
1.52 ± 0.84
1.77 ± 1.14
< 0.001
HDL-C, mmol/L
1.14 ± 0.28
1.17 ± 0.29
1.09 ± 0.25
< 0.001
LDL-C, mmol/L
2.20 ± 0.82
2.20 ± 0.81
2.20 ± 0.84
0.961
Hs-CRP, mg/L
2.09 ± 2.85
2.04 ± 2.90
2.19 ± 2.75
0.191
eGFR, mL/min per 1.73 m2
80.02 ± 15.07
81.03 ± 13.96
78.32 ± 16.66
< 0.001
FBG, mmol/L
7.48 ± 3.27
6.25 ± 1.80
9.57 ± 4.06
< 0.001
HbA1c
6.50% ± 1.18%
5.80% ± 0.34%
7.69 ± 1.15
< 0.001
Data are presented as mean ± SD, median (first quartile to third quartile), or n (%). BMI: body mass index; eGFR: estimated Glomerular filtration rate; FBG: fasting blood sugar; HbA1c: glycated hemoglobin; Hs-CRP: high sensitivity C-reactive protein; HDL-C: high-density lipoprotein cholesterol; LDL-C: low-density lipoprotein cholesterol; PCI: percutaneous coronary intervention; PLT: platelet; T2DM: type 2 diabetes; WBC: white blood cell.
Table
2.
Cognitive assessment results of study participants by HbA1c category.
Variables
Total population (n = 3244)
Low HbA1c group (< 6.5 mmol/L) (n = 2043)
High HbA1c group (≥ 6.5 mmol/L) (n = 1201)
P-value
MMSE Scale
MMSE Total score
27.53 ± 2.90
27.65 ± 2.81
27.33 ± 3.05
0.002
Orientation
9.70 ± 0.87
9.73 ± 0.83
9.65 ± 0.94
0.023
Memory
2.94 ± 0.30
2.94 ± 0.29
2.94 ± 0.31
0.789
Concentration And Calculation
4.14 ± 1.38
4.18 ± 1.34
4.06 ± 1.44
0.016
Recall
2.28 ± 0.88
2.30 ± 0.87
2.25 ± 0.89
0.205
Language
8.47 ± 0.87
8.78 ± 0.52
8.29 ± 0.97
< 0.001
MoCA Scale
MoCA Total score
22.85 ± 4.19
23.08 ± 4.13
22.45 ± 4.27
< 0.001
Visuospatial
3.31 ± 1.32
3.39 ± 1.31
3.19 ± 1.33
< 0.001
Naming
2.84 ± 0.49
2.84 ± 0.48
2.83 ± 0.51
0.716
Memory
2.23 ± 1.44
2.27 ± 1.45
2.17 ± 1.43
0.064
Attention
5.47 ± 1.01
5.51 ± 0.97
5.40 ± 1.06
0.006
Language
2.07 ± 0.78
2.11 ± 0.78
2.00 ± 0.78
< 0.001
Abstraction
1.15 ± 0.80
1.17 ± 0.80
1.11 ± 0.80
0.064
Delay Call
2.23 ± 1.43
2.26 ± 1.44
2.16 ± 1.41
0.060
Orientation
5.79 ± 0.67
5.81 ± 0.64
5.75 ± 0.71
0.032
SAS Scale
38.03 ± 9.14
37.95 ± 8.98
38.19 ± 9.42
0.470
ADL Scale
14.50 ± 2.21
14.42 ± 1.98
14.62 ± 2.55
0.021
SDS Scale
35.85 ± 7.66
35.72 ± 7.51
36.06 ± 7.91
0.234
Data are presented as mean ± SD. ADL: Activities of daily living; MMSE: Mini-mental state examination; MoCA: montreal cognitive assessment; SAS: self-rating anxiety scale; SDS: self-rating depression scale.


 DownLoad: